EleQTL
Download the EleQTL manualEleQTL is a web-based workbench and database for expression quantitative trait loci (eQTL) investigation.
It’s aim is to support the iC.elegans genetics community to utilities eQTL data in their research.
Currently it holds publicly available data of all published C.elegans eQTL studies.
Cis/Trans Plot
To get a genome-wide overview of the distribution of eQTL Cis/Trans Plot is most frequently used (REFs). The position of the eQTL peak is plotted on the x-axis against the position the genes for which these eQTL peak were found. We provide a default eQTL peak significance threshold per experiment at FDR of 0.05 for quick visualisation and an option to manually adjust this threshold for further exploration. The diagonal line of points show the Cis-eQTLs whereas so called hotspots or transbands can be recognized as vertical lines of points. This Cis/Trans plot has been made interactive by being able to select different experiment by a drop-down menu. Moreover the individual peaks (points in the Cis/Trans Plot) can be clicked to show the complete eQTL profile of the selected gene/peak. Lastly, the peak frequency per marker is show in the barplot below the Cis/Trans plot. Individual bars/markers can be clicked to obtain a figure and list with genes sharing a peak on the selected marker.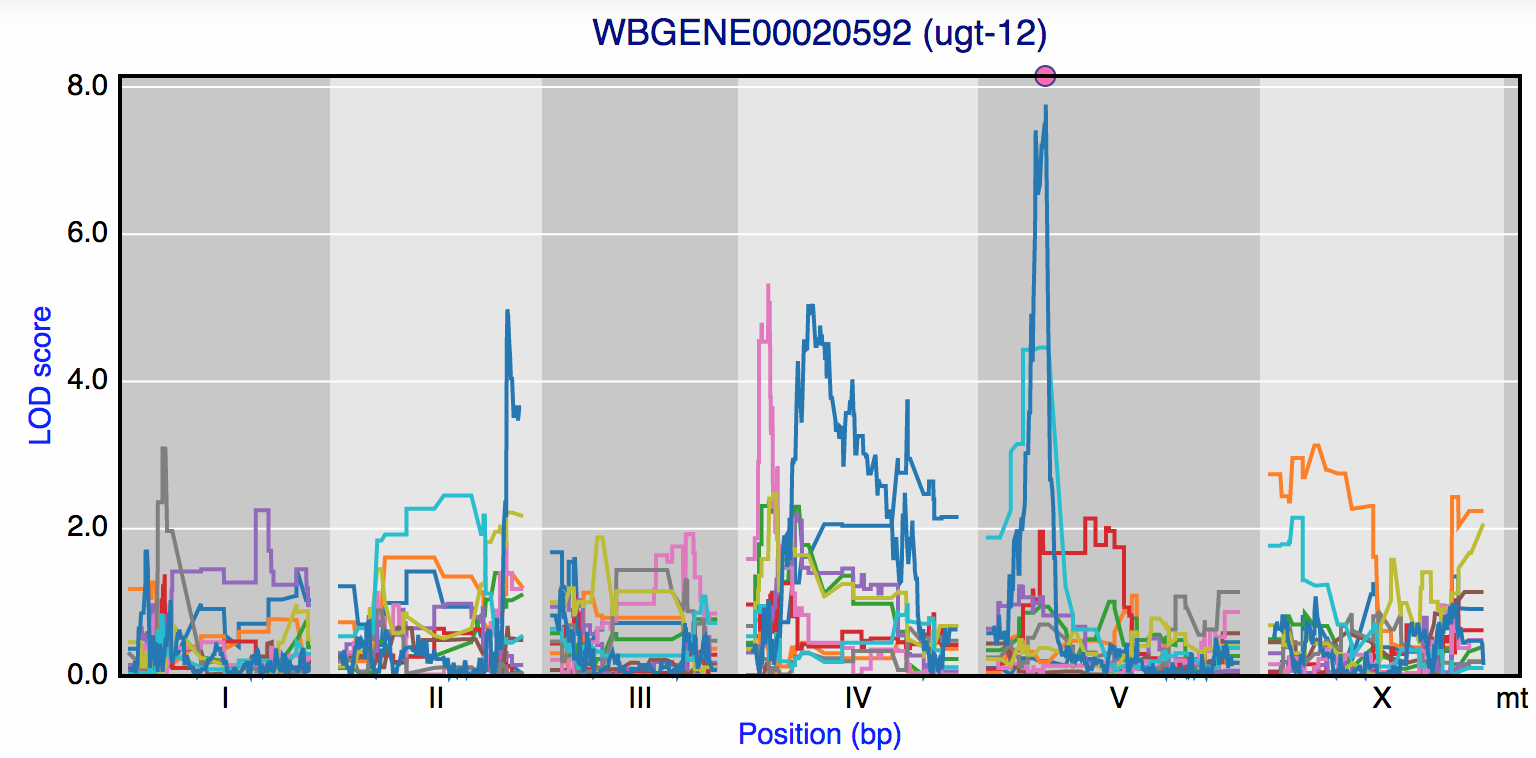
Gene eQTL profiles
In the “Gene eQTL profiles” window gene specific eQTL patterns between experiments can be compared. In this way experiment specific and co-occurring eQTLs can be easily recognised. Genes can be search and selected by a search box. The figure is interactive as points on the profile can be clicked which opens the window showing genes with an eQTL at the clicked marker in the selected experiment.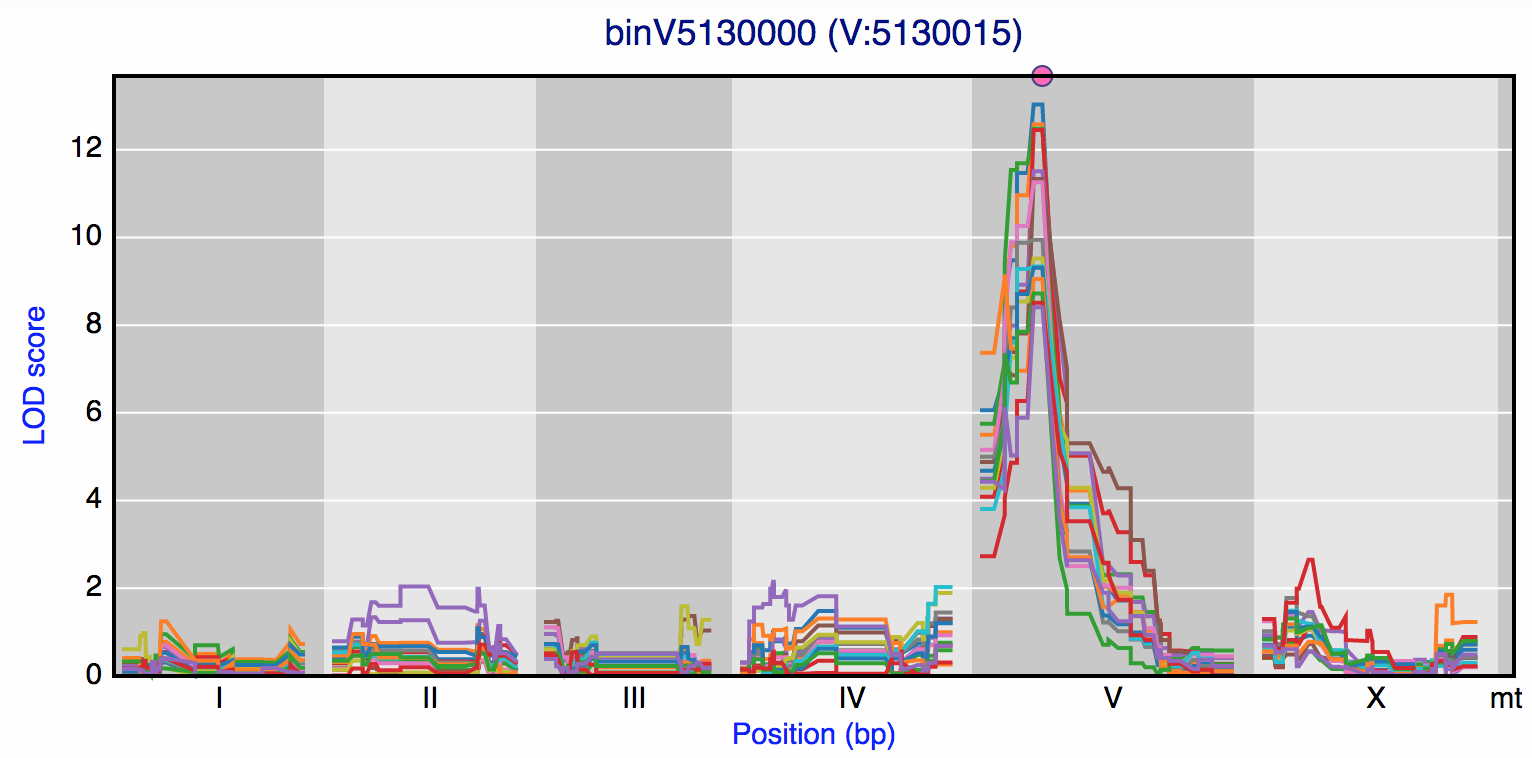
Shared peaks
To find genes with an eQTL at the same locus the “Shared peaks” window can be used. The profile of the ten genes with the highest LOD score is show in the figure and a list with all genes with a peak above the threshold is place below the figure. Experiment, marker and threshold can be selected.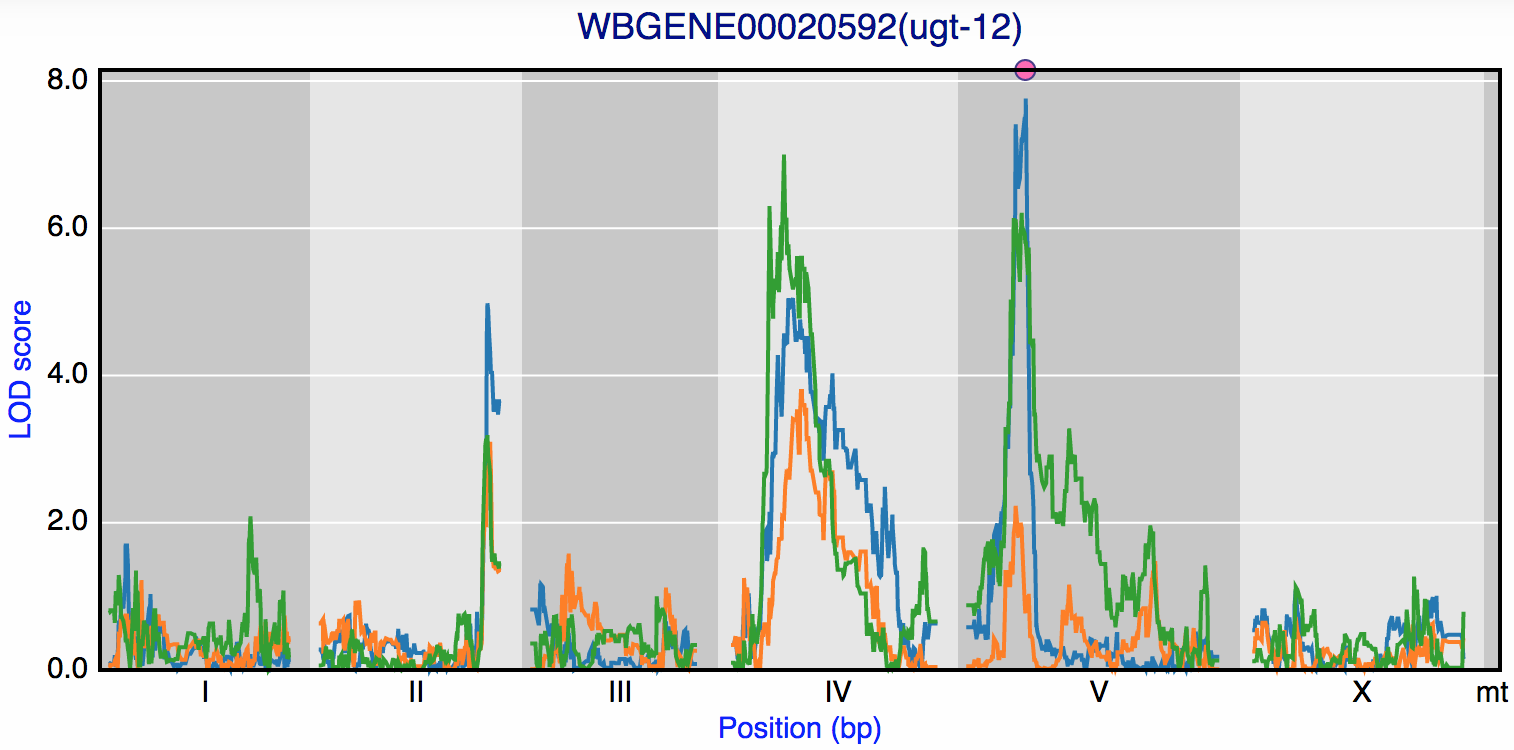
Correlated eQTL profiles
Extending from co-location of eQTL peaks the “Correlating eQTL profiles” window can be used to find genes with a correlated eQTL profile. This shows genes highly likely controlled by the loci (genetic architecture). Experiment, gene and correlation threshold can be selected. Specific peaks in the figures can be clicked to find genes sharing eQTLs at the selected marker.
Getting started
Find correlating eQTL profiles
Query per locus
What is WormQTL 2?
What is an eQTL?
To view all eQTL profiles for a certain gene, type its name or ID in the text box
and click the Search button.
To see a cis-trans plot with all eQTL peaks for a certain experiment, click on the experiment name.
You can search with a keyword to find genes and gene ontology (GO) categories.
Select the examples menu to see some example analysis with WormQTL 2.
To see a cis-trans plot with all eQTL peaks for a certain experiment, click on the experiment name.
You can search with a keyword to find genes and gene ontology (GO) categories.
Select the examples menu to see some example analysis with WormQTL 2.
Find correlating eQTL profiles
Show all genes for which the eQTL profile correlates with that of the query gene above the set cut-off,
in the selected experiment.
Strongly correlating eQTL profiles could indicate that the genes are regulated by the same loci.
Strongly correlating eQTL profiles could indicate that the genes are regulated by the same loci.
Query per locus
Show the eQTL profiles of genes with a LOD score above the threshold at the selected locus in the selected
experiment.
A locus can be a marker, a gene name, gene id or a genomic position (i.e. 2:11095452).
A locus can be a marker, a gene name, gene id or a genomic position (i.e. 2:11095452).
What is WormQTL 2?
WormQTL 2 is the C.elgans workbench and database for eQTL analysis.
It allows easy access to the data of all published Caenorhabditis elegans genetical genomics experiments.
WormQLT2 was modelled after AraQTL (the arabidopsis eQTL resource).
A paper describing WormQTL2 was published in Database:
WormQTL2: an interactive platform for systems genetics in Caenorhabditis elegans
What is an eQTL?
An eQTL is a genetic locus that was shown to affect the expression of the current gene.
eQTLs are the result of combining genomics with genetics, in "genetical genomics" Jansen and Nap Trends in Genetics 17(7):388-91 (2001)
eQTLs are the result of combining genomics with genetics, in "genetical genomics" Jansen and Nap Trends in Genetics 17(7):388-91 (2001)