Algorithm description

Background

Detecting meaningful clusters such as protein (super)families and complexes from large biological networks is critically important in many areas of genomics research. In particular, graph-based approaches have been used successfully for studying the functional and evolutionary relationships between proteins (or genes) on genome-wide scale. Graphs (networks) provide a framework to model the various relationhips between the biological entities. For example, nodes and edges might correspond to proteins and sequence-/structure-based similarities, respectively. Given a similarity or distance matrix obtained from all-versus-all protein comparisons (e.g. using the BLAST algorithm), the graph algorithms use user-defined thresholds to delineate "similar" proteins into protein clusters. Amongst the algorithms, the standard connected-component search has been widely used in grouping proteins into protein families or orthologous groups owing to its simplicity, scalability and biological soundness [Koonin04].

Graph-based implementation

There are two distinct algorithmic approaches to this problem:
1. The first approach requires an entire graph to be stored in computer's memory prior to detecting the clusters using either depth-first search (DFS) or breadth-first search (BFS) algorithms [Grimaldi99]. This approach (denoted as 'in core' from here on) is, however, memory-expensive particularly for large graphs of millions of nodes and/or edges (O(E) or O(N2) space-complexity depending on the implementation, E=number of edges, N=number of nodes).
2. The second, more memory-efficient approach (denoted as 'external-memory' from here on) does not need the entire graph to be stored in computer's memory but instead, the clusters are constructed gradually while reading-in the graph from a hard disk, hence saving a lot of memory space. This can be achieved using well-known family of UNION-FIND algorithms (UFA) [Tarjan75]. In the netclust program we implemented the asymptotically optimal UFA variant with (nearly)linear time- and space-complexity (O(E * alpha(E)) time-complexity in the worst-case scenario, E=number of edges, alpha=inverse Ackerman's function; O(N) space-complexity, N=number of nodes), hence enabling the analyses of very large data sets in almost real-time. The algorithm as used in netclust involves three abstract operations: (i) populate singletons, (ii) find group memberships, and (iii) merge groups sharing at least one member. The (preliminary) clusters are stored as rooted trees which are then subjected to two post-processing steps. First, each tree is "compressed" so that all nodes (members) of a tree point directly to the root of that tree. Second, the resulting trees (clusters) are sorted by size and labeled by increasing integer values.

Data input and output

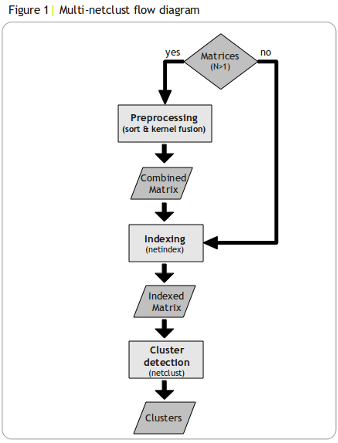
The netclust program takes an (un)directed weighted graph (network) in sparse matrix format as input and returns a list of clusters in a structured text file. In addition, the Multi-netclust tool enables multiple data networks to be combined using the kernel fusion (averaging) method proposed by [Kittler98], and then searched for clusters connected in all or in either of the networks. Prior to the cluster detection, the input graph must be indexed using the netindex utility to speed-up the the downstream processing. A user can set the similarity or distance cutoff value, depending on the input matrix, to control the sensitivity and specificity of results. For example, spurious similarities can be filtered out by choosing an appropriate cutoff value, which usually requires domain knowledge. Generally, a permissive cutoff may produce one large cluster while a strict cutoff may yield many singletons. The steps involved in the Multi-netclust workflow are schematically depicted in Figure 1.

Figure 1

Performance benchmark

Several artificial and real biological networks (Table 1) were used to compared the run-times and memory-usages of several available graph-based tools (Table 2). For each program we measured these values using the Perl's Benchmark module and the pmap Unix/Linux program, respectively. In total eleven networks were constructed using a simple Perl scripts and the BLAST program (version 2.2.17): eight artificial networks (denoted as T1-4, C1-4 and RN) and three biological networks constructed of UniProt and/or Refseq proteins and BLAST similarities (denoted as B1-3). Specifically, RN is a random Erdös-Rényi graph [Erdos59] whereas T1-4 and C1-3 are non-random 'thread-like' and 'cliquish' graphs, respectively. The benchmark analysis was conducted on an ordinary computer (Intel Pentium 4 3GHz CPU, 32 bit, 1GB RAM, 160GB SATA hard disk, SUSE Linux 10.0 operating system).

Table 1. Graphs (networks) used in the benchmark.
Graph N E C CN CE File size
T1 10,000 9,999 1 10,000 9,999 116K
T2 100,000 99,990 10 10,000 9,999 1.4M
T3 1,000,000 999,900 100 10,000 9,999 16M
T4 10,000,000 9,999,000 1,000 10,000 9,999 170M
C1 1,000 49,500 10 100 4,950 474K
C2 10,000 495,000 100 100 4,950 5.6M
C3 100,000 4,950,000 1,000 100 4,950 66M
RN 79,083 100,000 1,441 NA NA 1.4M
B1 178,228 2,745,123 35,397 NA NA 61M
B2 826,554 166,445,591 33,953 NA NA 4.6G
B3 2,713,908 781,328,458 41,072 NA NA 21G
N - total number of nodes, E - total number of edges, C - number of components, CN - number of nodes per component, CE - number of edges per component, NA - not applicable as the size of components varies.


Table 2. Available graph-based software.
Abbr. Software Source code Ref.
NET netclust (1.0) C
BCL BLASTClust, NCBI-BLAST package (2.2.18) C [1]
CLM clmclose, MCL package (1.006) C [2]

Results

The benchmark results show that netclust is significatly faster and requires less memory than the other software (Table 3). Besides netclust, only BLASTClust was able to handle the largest data sets tested herein. Although the BLASTClust software is efficient and reliable, its use is limited to BLAST similarity networks while netclust is generally applicable. Moreover, netclust is faster (up to 100 times) and requires less memory (about 56%) than BLASTClust.

Table 3. Comparison of available graph-based tools.
Software Graphs
T1 T2 T3 T4 C1 C2 C3 RN B1 B2 B3
NET 0.3s
0.5M
0.6s
4M
4.7s
38.3M
1m 12s
381.7M
0.5s
0.3M
1.5s
0.5M
15.1s
4M
0.8s
3.3M
0.5sa
7.7M
2m 13sa
32.3M
4m 47sa
104.6MB
BCL NA NA NA NA NA NA NA NA 1m 20sa
17.4M
3m 42sa
39.7M
17m 40sa
152M
CLM 2.8s
3.8M
23.2s
12.7M
3m 47s
115.7M
(32m 29s)
(1G)
0.6s
2.7M
3.9s
9.2M
39s
81.6M
1m 31s
11.4M
26.8s
40.5M
(>3G)c (>3G)c
Run-times given in seconds (s), minutes (m) or hours (h), and memory-usages given in megabytes (M) or gigabytes (G). NA - not applicable as BLASTClust can only handle BLAST similarity networks, results in parentheses '()' were obtained using a dedicated 64-bit computer with 32G RAM, arun-time obtained from precomputed and parsed/indexed BLAST similarity data, brun-time not determined due to the memory overflow, crun-time not determined due to premature termination of the matrix loading routine.


The scalability of the Multi-netclust tool to multiple networks was tested on the T4 example graph. The results of this analysis are shown in Table 4. The overall run-times roughly double with twice as many networks being analyzed. This is due to the increasing preprocessing time; the indexing and clustering times remained constant over all instances as the combined networks are identical to T4. Similarly, the amount of allocated memory remains constant, and is equivalent to the amount allocated for a single T4 network, which is 381.7M of RAM.

Table 4. Scalability of the Multi-netclust tool to multiple networks.
N Networks Run-time
2 T4 + T4 5m 27s
2 T4 x T4 6m 30s
4 T4 + T4 + T4 + T4 9m 10s
4 T4 x T4 x T4 x T4 10m 52s
8 T4 + T4 + T4 + T4 + T4 + T4 + T4 + T4 16m 26s
8 T4 x T4 x T4 x T4 x T4 x T4 x T4 x T4 18m 50s
Symbols 'x' and '+' refer to the product and sum aggregation rules, respectively.


References

[Koonin04] Koonin, E. V. et al.: 2004, A comprehensive evolutionary classification of proteins encoded in complete eukaryotic genomes., Genome Biol 5, R7.
[Grimaldi99] Grimaldi, R. P.: 1999, Discrete and Combinatorial Mathematics, 4th ed., Addison-Wesley Longman, Inc.
[Tarjan75] Tarjan, R. E.: 1975, Efficiency of a Good But Not Linear Set Union Algorithm, J ACM 22, 215-225.
[Kittler98] Kittler, J. et al.: 1998, On combining classifiers. IEEE Trans Pattern Anal Mach Intell. 20, 226-239.
[Erdos59] Erdös, P. and Rényi, A.: 1959, On random graphs. Publ Math 6, 290-297.
[1] NCBI BLASTClust
[2] MCL