A tool for visualization of phylogeny and protein domain structure.
Blaise Alako, Daphne Rainey, Harmn Nijveen and Jack Leunissen
Department of Bioinformatics Wageningen University and Research Centre PO Box 8128 6700 ET Wageningen the Netherlands
Treedomviewer short description.
Phylogenetic analyses and examination of protein domains are critical to comparative genomic studies. These techniques allow accurate genome annotation and are invaluable to studies of protein and protein complex evolution. Treedom viewer is a powerful visualization tool available as a PERL web based interface, that takes phylogenetic tree description, sequences alignment and InterproScan raw format of the sequences to analyze, and produces a phylogenetic tree with the corresponding protein domain information obtained from InterproScan. Treedom viewer produces an interactive scalar vector graphic (SVG) image with alternative pixel format (JPEG, PNG). This allows the user in one glance to see the orthological relationship and domain content of the proteins of interest.
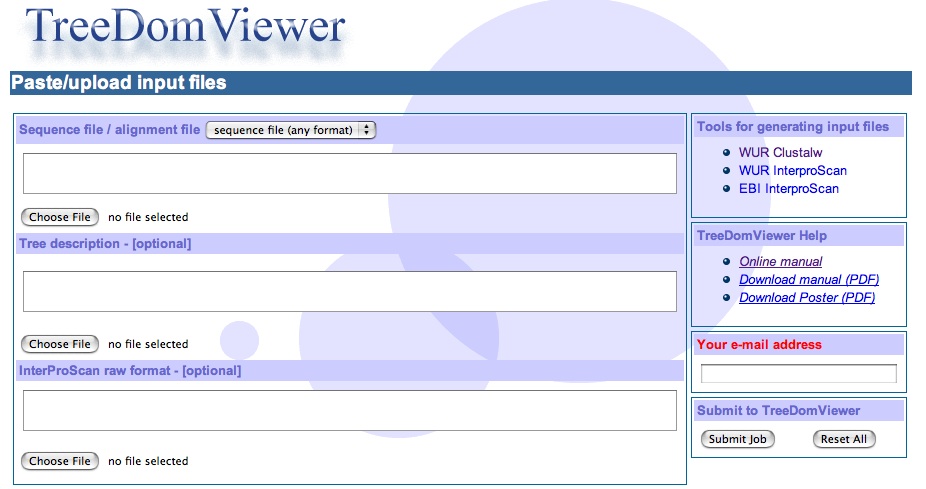
1) The Input file section
The minimal input to TreeDomViewer is a multi-fasta sequence file. Others standard formats are also accepted.
Example multi-fasta input sequence fileAlternatively Treedomviewer accepts three input files that could be paste in the text area or uploaded as plain text file.
Tree description is in phylip format;
(
Q5A8M1_CANAL:-0.01990,
Q5A8U5_CANAL:0.03054,
(
O74127_YARLI:0.23854,
Q5VJ86_9PEZI:0.36263)
:0.30123[1000]);
Alignment file is in clustalw format
CLUSTAL W (1.83) multiple sequence alignment
Q5A8M1_CANAL MSSTTFNDIIDSVLPYLTKWYTILIGAGLIFVLSTNLKNAYYSYKLGCKNPVHLKRAGWT
Q5A8U5_CANAL MSSTTFNDIIDSVLPYLTKWYTILIGAGLIFVLSTNLKNAYYSYKLGCKNPVHLKRAGWT
O74127_YARLI ---------MSNALNLSLALGVFLLAYYGFSVIQYRIKTRKLEKKWKCGKPKDISRFPFS
Q5VJ86_9PEZI ---------MMDPFYLLGGCCVFGIVYKSVATLYVNYVHGKTARELGCK-PLPKERTRFF
: . : .: : . .: . : * * .*:
....
And InterproScan file is the raw format, a tab delimited file.
Q5VJ86_9PEZI ACE9B750CAD1371B 525 HMMPanther PTHR19383:SF58 CYTOCHROME P450 52A, SUBFAMILY 52 13 520 5.6e-136 T
18-Jul-2006
Q5A8M1_CANAL 83B145FB8313F2D1 526 Gene3D G3D.1.10.630.10 no description 45 525 4.1e-84 T
18-Jul-2006
Q5A8M1_CANAL 83B145FB8313F2D1 526 HMMPfam PF00067 p450 57 525 6.1e-28 T
18-Jul-2006
O74127_YARLI 2CE8576B6CFFFAA8 523 superfamily SSF48264 Cytochrome P450 42 514 5.9e-89 T 18-Jul-2006
Q5A8M1_CANAL 83B145FB8313F2D1 526 FPrintScan PR01239 EP450IICYP52 270 290 3.2e-42 T 18-Jul-2006
Q5VJ86_9PEZI ACE9B750CAD1371B 525 ScanRegExp PS00086 CYTOCHROME_P450 460 469 NA ?
18-Jul-2006
NB: you may either paste or upload a file not both.
The Tool for generating input file subsection on the right provides links to tools that may be used to generate the input files.
Alternatively the user may edit his/her input file before a TDV run. Below is a description of the interproscan raw format. This is a tab delimited file
| column1=protein id | column2=Checksum | column3=sequence length | column4=prediction method | column5= method id | column6=start-stop position | column7=description | column8=More description |
| used by TDV | not used by TDV | used by TDV | used by TDV | used by TDV | used by TDV | used by TDV | used by TDV |
2) Tree parameters section
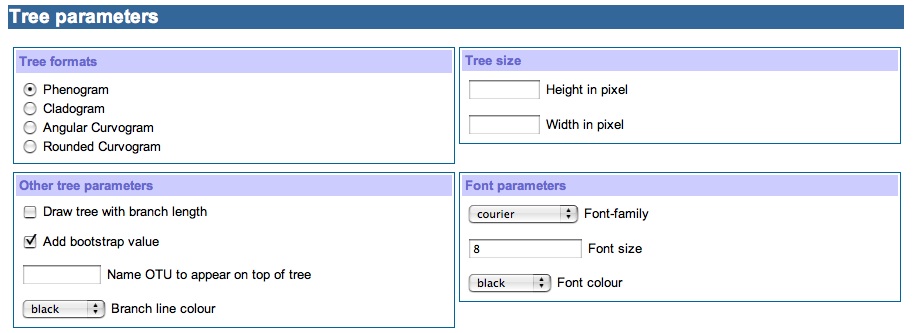
The tree format subsection provides options to how the tree should be draw. We do provide besides phenogram and cladogram custom Bioinformatics department made angular curvogram and rounded curvogram. The phenogram tree format is the default value for this subsection.
The subsection Other tree parameter gives the options of viewing tree with branch length, bootstrap value and name of the protein to appear in the up most position, by default these options are switch off. The branch line color defines the color of the tree branches and is set to black by default.
The subsection Tree size provides options for setting the height and width of the tree to be drawn”.
The subsection Font parameter provides options for font family, font size and font color. Defaults are courier, 9, and black respectively.
3) Domain parameter section
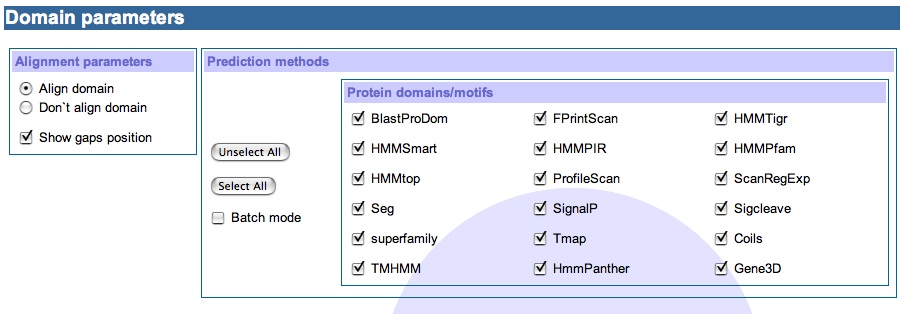
Here is an added value to visualization of the tool. The pasted or uploaded alignment sequence allows us to view the predicted InterproScan domains as aligned or unaligned blocks. We are also given the choice to view the gap insertion from the alignment file or not. As all the domains are solely predicted by InterproScan, we do also provide option to switch on or off one or all of the thirteen InterproScan prediction methods. By default all the prediction methods are selected.
4) Output format section
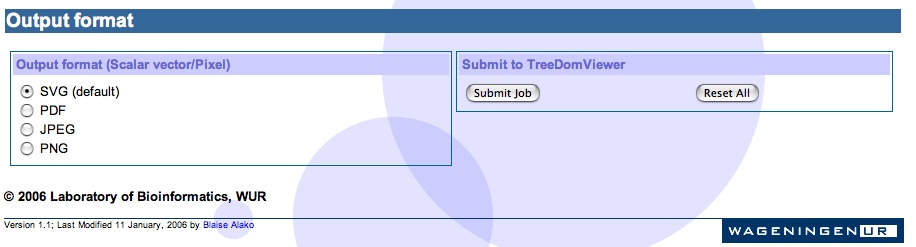
We devoted attention to SVG output as having the following advantages:
Ø Scalable Vector Graphics (SVG) is text that defines an image.
Ø SVG graphics do NOT lose any quality if they are zoomed or resized.
Ø Every element and every attribute in SVG files can be animated.
Ø SVG files can be read and modified by a large range of tools (e.g. notepad).
Ø SVG files are smaller and more compressible than JPEG, PNG or GIF images (bitmap format).
Ø SVG images can be printed with high quality at any resolution.
Ø Text in SVG is selectable and searchable.
Ø SVG works with Java technology making animation on web pages much easier.
However the major drawback of SVG at the moment is that no browser fully supports SVG. Nevertheless, the future of SVG seems bright: Mozilla and Microsoft plan to fully support SVG.
We also provide portable document format (PDF), and bitmap format (JPEG, PNG) as alternative output format.
5) Sample Output: Visualization of the lipocalins family.
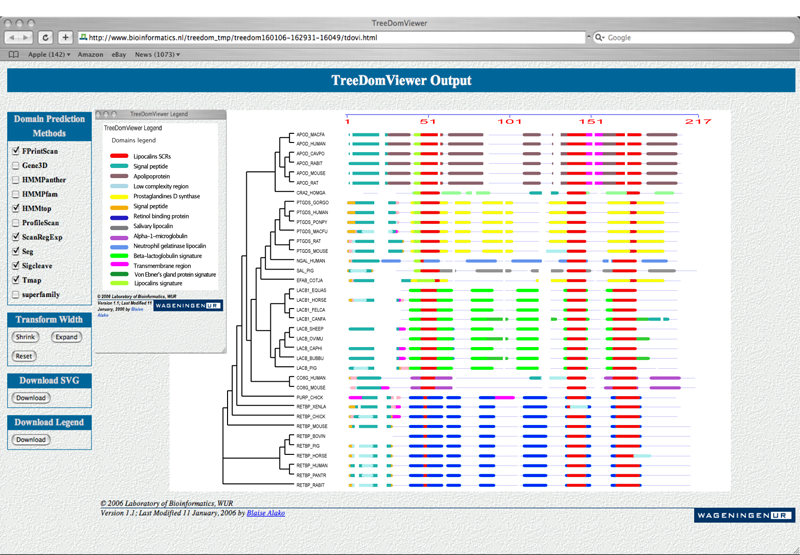
The left control panel ‘Domain prediction methods’ allows the user to switch on and off the corresponding domain (same color).
The scale gives an idea of the relative length of the sequences upon insertion of gap. Embeded in this picture is the legend giving a quick lookup definition of the predicted domains