|
Overview
Digestions
pGT4ΔB
Electrophoresis
DNA clean-up
Ligation
Fragment isolation
Competent cells
Transformation
Recombinants
pGTλ3758ΔH
Miniprepping
Blotting
Probe Labeling
Hybridisation
Probe Detection
PCR |
Agarose gel electrophoresis
Agarose gel electrophoresis is employed to check the progression of a
restriction enzyme digestion, to quickly determine the yield and purity of a DNA
isolation or PCR reaction, and to size fractionate DNA molecules, which then
could be purified from the gel if necessary.
The agarose gel is made by
dissolving the solid agarose powder in the electrophoresis buffer. Usually Tris-AceticAcid-EDTA ("TAE") buffer is used. A commonly used stock
solution for TAE is 50 times concentrated ("50xTAE"; the standard procedure for
preparation of 50xTAE is: mix deionised water with solid Tris powder, a certain
amount of an EDTA stock solution, usually 0.5M EDTA pH8.0, and concentrated
acetic acid to adjust the pH to 7.6). The agarose will only fully dissolve when
boiled for a few minutes and the warm gel solution then is poured into a mold
which is fitted with a well-forming comb. Cooling down to room temperature
results in the slow formation of a solid gel when the concentration of agarose
is between 0.5 and 2% (weight/volume).
To make the DNA visible in the gel,
ethidium bromide is added to the gel solution and the buffer (it can also
be left out of the gel and buffer; staining of the gel can be done in
that case after the gel run..). This positively
charged polycyclic aromatic compound binds to DNA by inserting itself between
the basepairs ("intercalation"). The DNA bands can be seen by exposure of the
gel to ultraviolet light, due to the the large increase in fluorescence of the
ethidium bromide upon binding to the DNA.
Agarose gels are submerged in
electrophoresis buffer in a horizontal electrophoresis apparatus. This buffer
both conducts electric current and controls the pH of the solution during
electrophoresis. DNA samples for loading into the wells ("slots") of the gel are
prepared by addition of a tracking dye (e.g. Orange G or Bromo Phenol
Blue)which also contains a component (usually
glycerol or sucrose) to increase the density of the sample to facilitate the
loading.
Electrophoresis usually is at about 5 Volts per cm for 0.5 - 2 hours or
more at room temperature, depending on the desired separation. Size markers may
be co-electrophoresed with DNA samples, when appropriate for fragment size
determination. Many commercial size-marker sets are available with different
size ranges.
After electrophoresis, the gel is placed on a UV light box and a
standard or digital photograph of the fluorescent ethidium bromide-stained DNA
separation pattern is taken.
This is what a
(black-and-white photograph of a EthBr-stained) typical gel looks like
after the electrophoresis:
 |
|
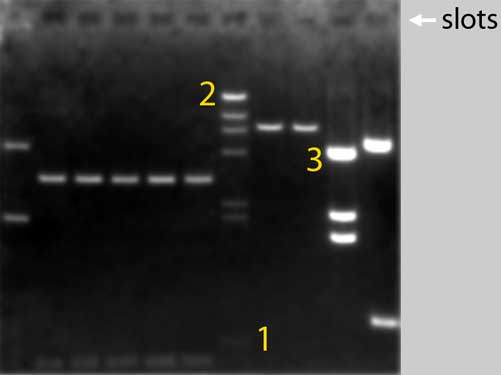
Above you see a
black-and-white photograph of an agarose gel. Before we took
this picture, we applied an electrical field across the gel
which was submerged in a buffer solution. During this
so-called electrophoresis the DNA fragments in the samples 1
to 11 moved from their origen, the sample wells (or:
slots), through the gel towards the positive electrode
that’s from top to bottom in the picture. The gel matrix
acts as a sieve: smaller DNA molecules migrate faster than
larger ones, so DNA molecules of different sizes separate
into distinct bands during electrophoresis.
To visualise the DNA fragments we added the staining agent
Ethidium Bromide to the gel and the buffer solution. We
exposed the gel to ultraviolet light and we saw the DNA's as
fluorescent, orange bands.We photographed the gel with a
camera provided with a UV filter.
More DNA in a band gives more intense staining of that band.
So, for example, 50ng of DNA in a band gives two times more
(= brighter) staining than 25ng. You can see this very
clearly in lane 7, where restriction fragments originating
from one microgram of identical DNA molecules are separated.
Which means that the bands contain equimolar amounts DNA.
The smallest fragment of 564 basepairs (1) is hardly
visible, while the biggest fragment of more than 23.000
basepairs (2) shows a very bright band.
Band 3 contains smaller DNA fragments than band 2,
but is still much brighter. This is because there is more
(nanograms of) DNA in 3 than in 2 (the number of molecules
in 3 must be much higher than in 2). |
Plasmid DNA can exist in three conformations: supercoiled,
open-circular (oc), and linear (supercoiled plasmid DNA is often
referred to as covalently closed circular DNA, ccc).
In vivo, plasmid DNA is a tightly supercoiled circle to enable it
to fit inside the cell. In the laboratory, following a careful plasmid
prep, most of the DNA will remain supercoiled, but a certain amount will
sustain single-strand nicks. Given the presence of a break in only one
of the strands, the DNA will remain circular, but the break will permit
rotation around the phosphodiester backbone and the supercoils will be
released.
A small, compact supercoiled knot of ccc-DNA sustains less friction
against the agarose matrix than does a large, floppy open circle of
oc-DNA. Therefore, for the same over-all size, supercoiled DNA runs
faster than open-circular DNA. Linear DNA runs through a gel end first
and thus sustains less friction than open-circular DNA, but more than
supercoiled. Thus, an uncut plasmid produces two bands on a gel,
representing the oc and ccc conformations. If the plasmid is cut once
with a restriction enzyme, however, the supercoiled and open-circular
conformations are all reduced to a linear conformation.
Following isolation, spontaneous nicks accumulate as a plasmid prep
ages. This can clearly be seen on gels as the proportion of the two
conformations change over time: plasmids preps that have been thawed and
refrozen many times, show more oc DNA than fresh preps.
An example:
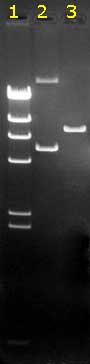 |
This is a black-and-white photograph of an
agarose gel containing ethidium bromide, after electrophoresis
of three DNA samples. The gel was on a UV lamp when
photographed. It was weakly orange while the DNA bands had a
bright orange color due to the specific binding of the EthBr to
the DNA molecules.
The migration was from top to bottom: the anode (+) was at the
bottom side of this gel; the kathode (-) at the top. Smaller DNA
molecules migrate faster than large ones.The bands differ in
intensity: larger fragments bind more EthBr. This is very good
visible in the size marker lane 1. All fragments
in this lane are generated by digestion of one particular DNA,
so fragments are present in equimolar amounts and the brightness
of the bands corresponds to their (well-known) lengths.
It is clear that in
lane 2 two fragments are present in
non-equimolar amounts (the upper band must contain longer DNA
molecules, but is less intense than the lower band..). In this particular case it's because they
represent two circular forms of the same plasmid DNA (oc on
top, and ccc below). The ratio of the amounts of DNA in both
bands depends on the age and quality of the plasmid preparation.
Note: the (linear DNA) bands in lane 1 cannot act
as size markers for the circular DNAs in lane 2!!
Lane 3 shows a comparable amount of that plasmid, digested with
a restriction enzyme which linearised the circular DNA's |
See also SCLResources>Lambda DNA for
information about the gel band pattern of a Lambda DNA digest. |